What will the stock market do?
When presented with this ageless question the illustrious John Pierpont Morgan, the man who put the P in JP Morgan (his father Julius having contributed the J) and the financier who dominated Wall Street throughout America’s Gilded Age, simply replied; “It will fluctuate”.
This was no glib avoidance of the question but rather reflects one of the defining characteristics of any market; they are volatile. Prices go up and down. Volatility is the chief manifestation of risk and there are few things that drive volatility as much as uncertainty.
The start to 2022 has, to put it mildly, been volatile. Initially driven by uncertainty as to how fast and far central banks will tighten monetary policy to fight higher than expected inflation. To this potent mixture was added war in Europe that has rapidly increased global energy prices especially for gas in Europe which naturally brings negative economic considerations. Against this backdrop it is unsurprising that markets have moved into correction territory with some indices such as the NASDAQ entering a bear market. This begs the question; how should investors approach corrections and bear markets?
Corrections and bear markets are common.
“Happy families are all alike; every unhappy family is unhappy in its own way.”
The opening line of Leo Tolstoy’s Anna Karenina
Like Tolstoy’s unhappy families (and there are many in his voluminous novels), each drawdown has its own unique origins, duration, and magnitude. However, we can learn much about their communality from considering historic corrections. Foremost, is that market declines (pullbacks, corrections, and bear markets) are more frequent than is commonly understood and are a fact of investing life.
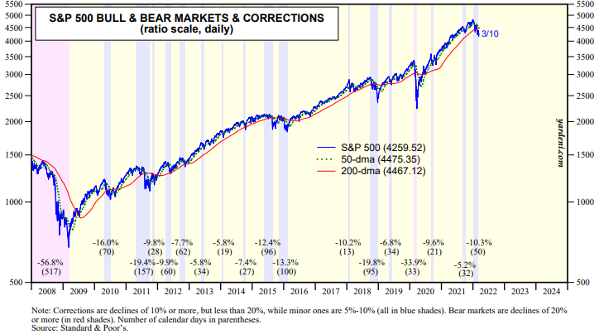
Since the start of 2008 the S&P 500 index has seen 9 corrections (peak to trough declines greater than -10%), about one every 1.5 years. If we count minor corrections (declines of -5 to -10%, often classified as pullbacks) of which there were 18, then we see a market decline event every 9 months. While bear markets (falls of -20% or greater) are rarer with two occurring over the time period. The average decline for a correction is -14.5%, corrections and pullbacks together -10.5% and adding bear markets all negative market events average a decline of -14.5%. In short, such events are common and a critical part of the market pricing function as it assimilates new information and prices probabilities.
From an investment perspective a key factor to consider is the duration (length) of a negative market. Since 2008 the average length of a market decline event is 80 days (2.6 months) or for bear markets and corrections 125 days (4.1 months). Over time we have seen the speed of corrections and bear markets increase as information and capital flows move and trade at increasingly rapid rates. Algorithmic trading, for instance, has even removed the slower fleshy element from decision making – though not always with the best results. It is, therefore, worth noting that the S&P 500 is now well into the third month of this correction and the NASDAQ into the fifth month of its bear market.
So, what comes next?
“You asked me what I learned. I didn’t learn anything. I already knew that I wasn’t supposed to do that. I was just an emotional basket case and couldn’t help myself.”
- Stan Druckenmiller, reflecting on losing $3bln in 6 weeks.
Stanely Druckenmiller was a senior member of the team who under the leadership of George Soros famously broke the Bank of England. Bringing the sterling to its knees and his consistent investment performance over decades has well earned him his place in the annals of illustrious investors. In 1999 he correctly determined that tech stocks were in a bubble. The problem was he was right too early, and this ended up costing him much more than just straight forwardly being wrong.
In February 1999 while still working for Soros, he placed a $200mln short bet against the tech sector. By mid-March that bet lost him $600mln, he then closed the position. Fast forward a year to March 2000, and Druckenmiller is buying $6bln worth of tech stocks, having capitulated and followed the direction of the market despite knowing he ‘wasn’t supposed to do that’. By his own reckoning he bought in about 1 hour after the absolute top of the 2000 tech market. Within six weeks he had lost $3bln and left the company.
The lesson here is that market timing is extremely hard. So much so that even legends of the investment industry have got it fantastically wrong. As the famous economist John Maynard Keynes wrote nearly a century ago (and one of the first lessons I was taught upon entering the investment world) ‘Markets can stay irrational longer than you can stay solvent’.
However, the cautionary tale of Stanely Druckenmiller also provides for a lesson in investment psychology; losses hurt disproportionately. That is, they hurt more than gains of the same amount feel good. It feels far worse to bet $100, win $100 and then subsequently lose $100, than it does just to have kept $100 in your pocket all along, even if the end result is identical. This is a cognitive bias referred to as loss aversion, that can often lead to sub-optimal, even non-rational decisions and is most commonly found among investor behaviours during time of loss.
The nature of corrections and bear markets are such that the majority of investors lose money. Losses are small at the start of such markets (often before they can be identified) and, by definition, become larger as we approach the end. Thus, the larger the loss the more likely we are to be approaching the inflection point. Even against a backdrop there is always the temptation to try and time the market bottom, that is to sell out of your holdings and come back at or after the market bottom. Much like Druckenmiller’s ill-timed short and long bets, this strategy rarely pays off.
Why?
Missing the upside.
Because to pull off this ambitious strategy one has not only to correctly identify the bottom of the market, a bet which would rely more heavily on chance than analysis, but it is also to miss what are typically the most lucrative return periods in an investment cycle – the bounce and the recovery.
Analysis by JP Morgan of market returns over the past 20 years show that 7 of the 10 highest return days came within two weeks of the 10 worst days. Further 6 of those 7 best days came after the worst days. For example, the second worse day of 2020, March 12th, was followed by the second-best day of the year. Thus, the real cost of ‘cashing out’ is to crystalise one’s losses and miss these up days or ‘bounces’.
And these days really do matter. Missing them makes a colossal difference to investment returns – not least because investment gains compound.
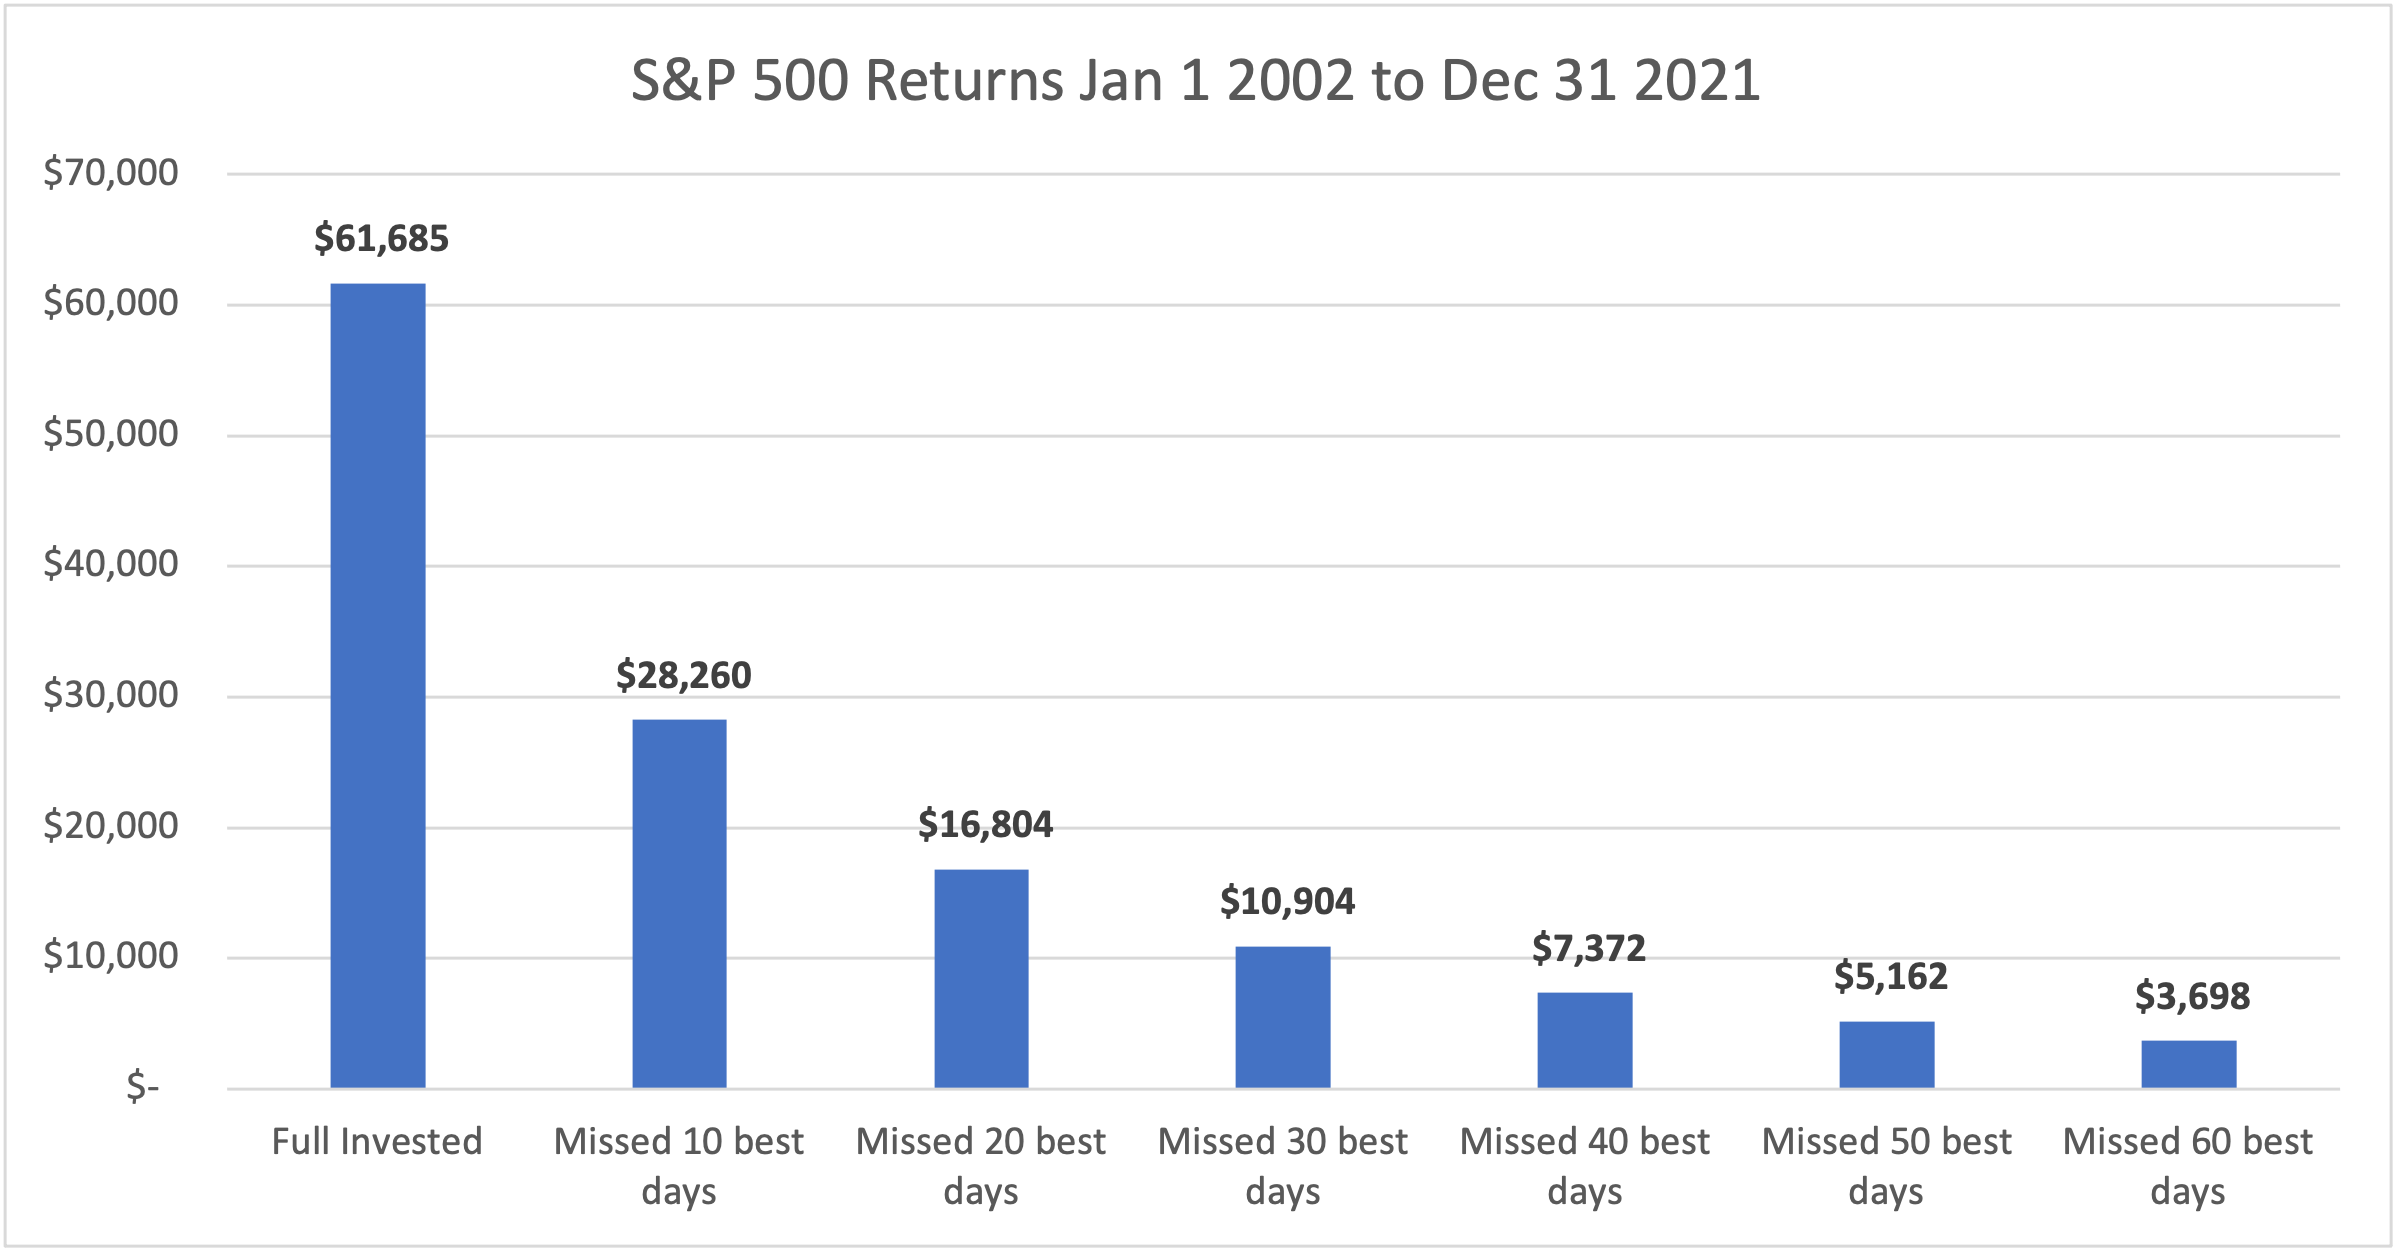
If one had invested $10,000 in the S&P500 twenty years ago it would, by December 31st, 2021, be worth $61,685 generating a 9.5% annual return. Missing the 10 best days would generate a return of less than half as much. If you missed the 30 best days, you would have only made $904 profit. Missing the 40 best days you slide into loss.
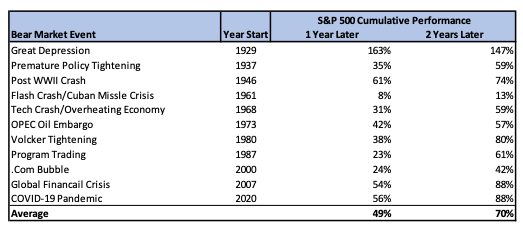
Further, the supra-normal post-negative market returns are not just limited to the short term. Indeed, some of the best return periods in investment history have occurred after bear markets. This is because markets, like a random walking pigeon, seldom if ever travel in straight lines. Rather it swings like a pendulum between exuberance and depression, between over optimistic and over corrected – though the latter happens considerably more rapidly. It is, therefore, when the pendulum swings back from an overcorrection that we see the most positive returns that are critical to long term investment success with the market (the S&P since the Great Depression) up +49% on average a year after a bear market, +70 % after two years.
Poor timing only cost Stanely Druckenmiller $600mln, reversing his position late in the game cost him $3bln and his job. Selling out after significant markets declines may not engender further losses but may limit returns for years to come.